70% of new product development projects
deliver late.
The problem is not the people - it is the planning system. Project-manager planning in a silo erodes ownership. Overloaded dependency views hide critical handoffs. And when issues are not visible in real time, teams discover delay after good recovery options are already gone.
This is not theory-only advice. It comes from hard-won field experience, including projects where a five-minute missed cross-functional decision cascaded into a three-month slip.
VPM Works replaces PM-silo control with team-driven visual execution. It structures projects to use buffer to hold original dates without the baggage of other buffer-based methods like Critical Chain Project Management. And it has a novel use of RACI* to create the best of both worlds: detailed execution in Gantt format for daily work and clean swim lane format of cross-functional flow for nimble pivots.
*RACI: Responsible, Accountable, Consulted, Informed.
Why Most Projects Start Wrong
Traditional tools create complexity instead of clarity. Teams lose sight of what matters and spend their energy managing the plan instead of delivering the product.
Gantt Charts Flatten Everything
Every task gets equal visual weight. A minor admin step looks the same as a critical cross-functional handoff. With 200+ dependencies, no one can see the real drivers of schedule performance.
Brittle Dependency Networks
Traditional plans break on first contact with reality. When requirements change, you face an impossible choice: spend hours rewiring dependencies, or let the chart go stale. Most teams choose the latter.
Single Critical Path Thinking
CPM assumes one dominant path — but in complex projects, multiple paths compete. When the critical path shifts mid-project, most teams don't see it until delays have already accumulated.
Handoffs Are Invisible
The moments of greatest risk — when accountability transfers between teams — get the same treatment as any other task. Cross-functional coordination breaks down silently.
Why VPM Works
Three practical design choices create the core advantage in execution.
From PM Silo to Project Team
- Teams plan together and agree to schedule targets up front, creating shared ownership from day one.
- Sub-10-minute standups several times each week sustain team ownership and surface risk early.
- Project managers shift from administrators to facilitators of core-team success. When problems arise, teams turn into an army of solvers.
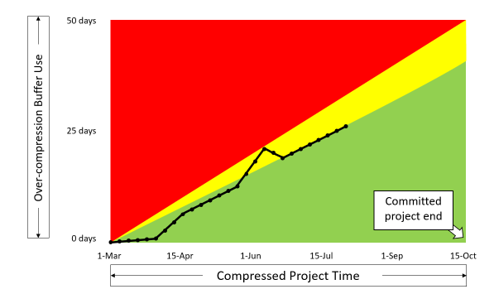
Buffer Without the Baggage
- Buffer is segregated from the original schedule to protect the commit date, not added to pad timelines.
- Buffer added with team consensus and common sense, not the mathematical gymnastics seen in competing methods like Critical Chain Project Management.
- Buffer burn triggers immediate Stop-Fix action, not weeks of drift while teams hope the plan recovers on its own.
Multiple Views for Multiple Purposes
- Swim Lane view keeps cross-functional flow visible to manage the inevitable project issues when they occur.
- Gantt view preserves detailed planning so every task and deliverable is accounted for in daily execution.
- Skyline view helps teams plan resource needs ahead and review resource performance after delivery.
Ready to Fix How Your Projects Start?
Whether you're a PMO leader, a project manager, or teaching the next generation — VPM can transform how your teams deliver.